Swiftly Track Viewer Interactions
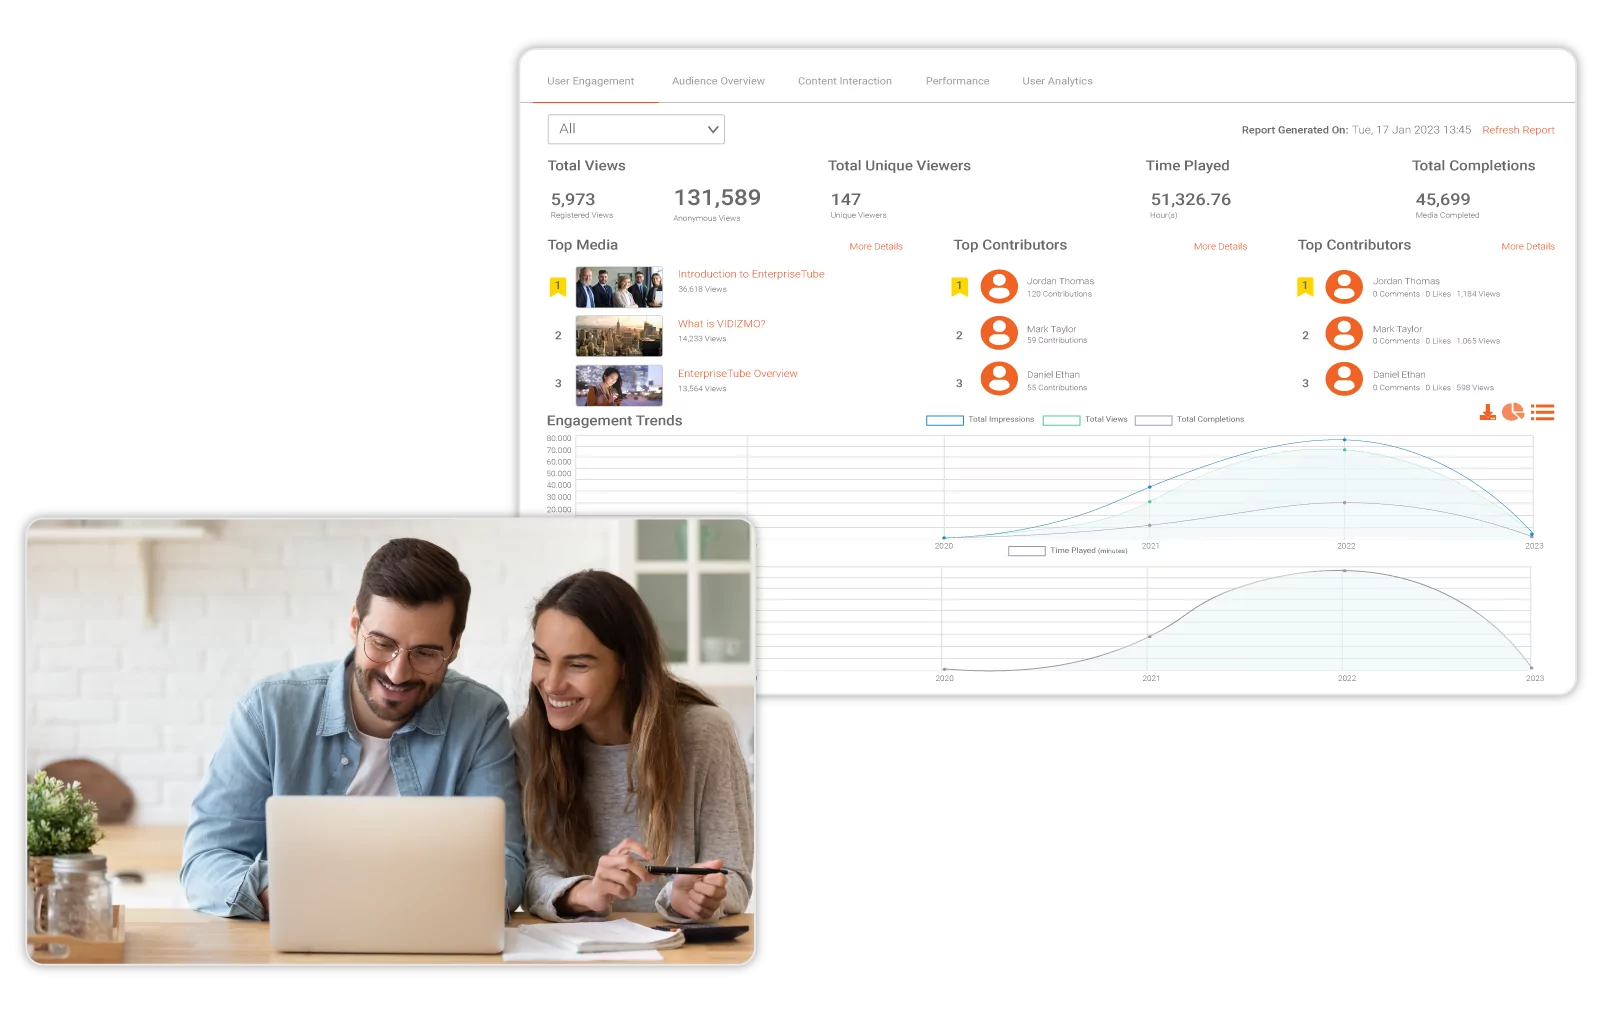
Gain a Deep Understanding of your Audience
Know who your audience is and understand their content preference to deliver content that garners higher engagement.
Generate Actionable Insights in Consolidated Dashboards
Multiple dashboards for aggregate video analytics and quality of experience reporting, to swiftly generate practical advice for improved user experience and video performance.
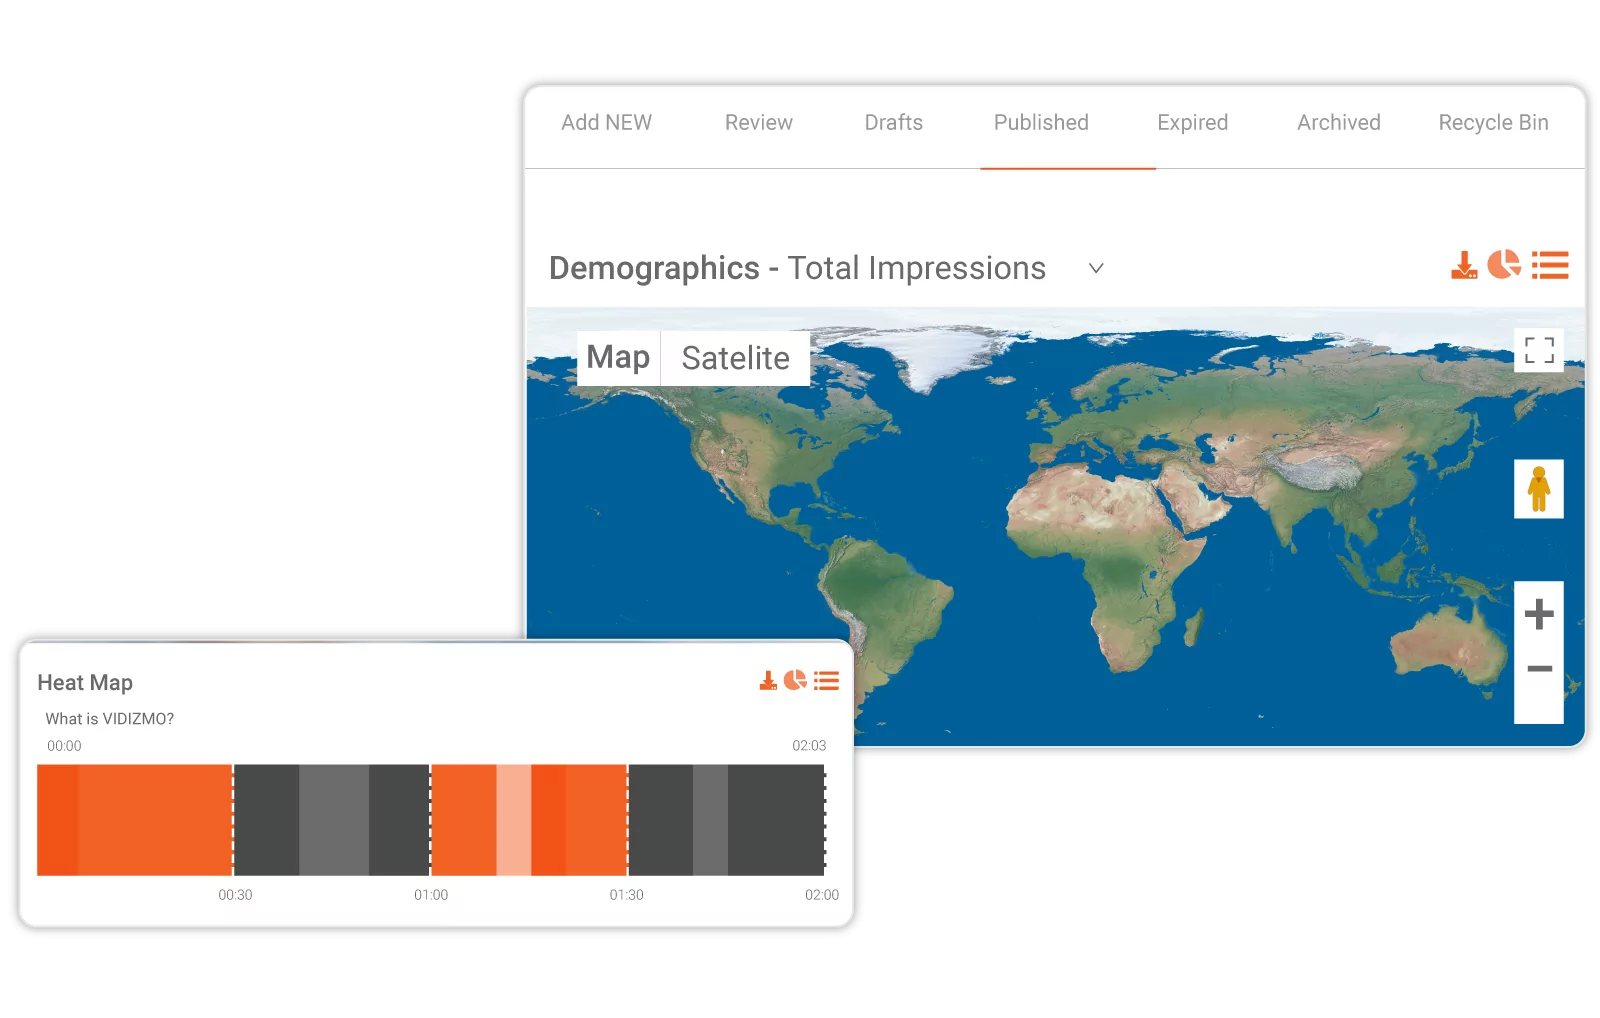
Analyze a Single Video or a Hundred
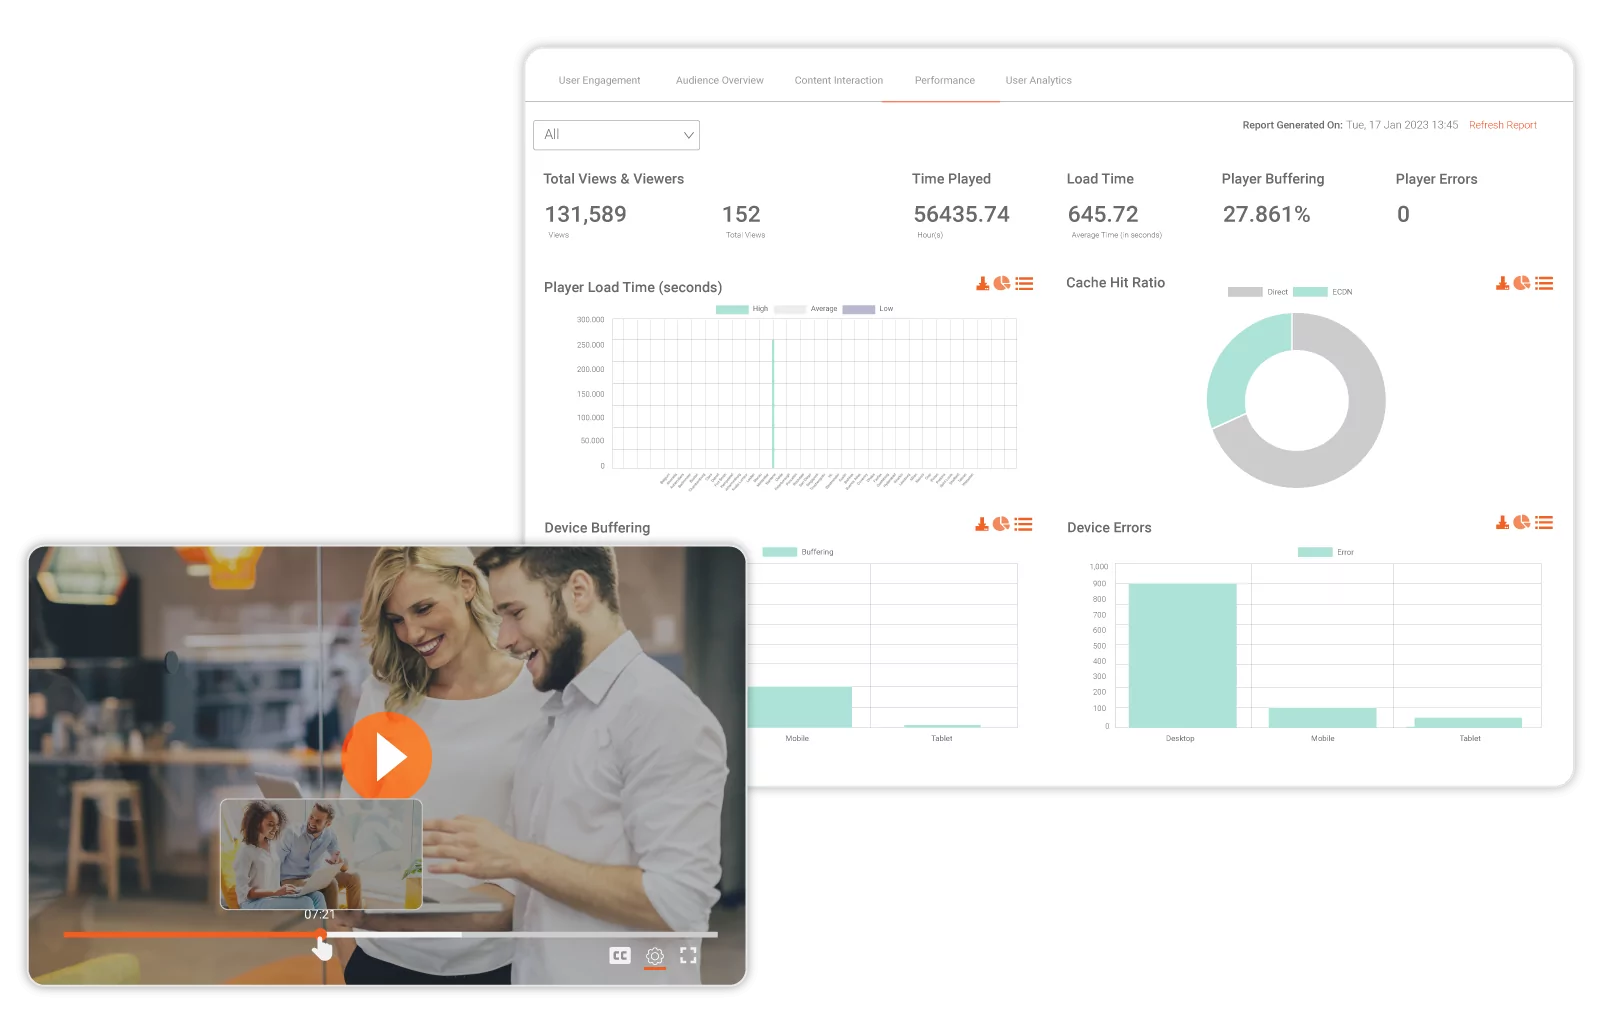
Proactively Ensure Quality Video Experience
Are you delivering a quality video experience? Avoid disappointing your viewers! Monitor end-user’s video experience through a QoE dashboard to track various video performance metrics.
Generate User Focused Analytics
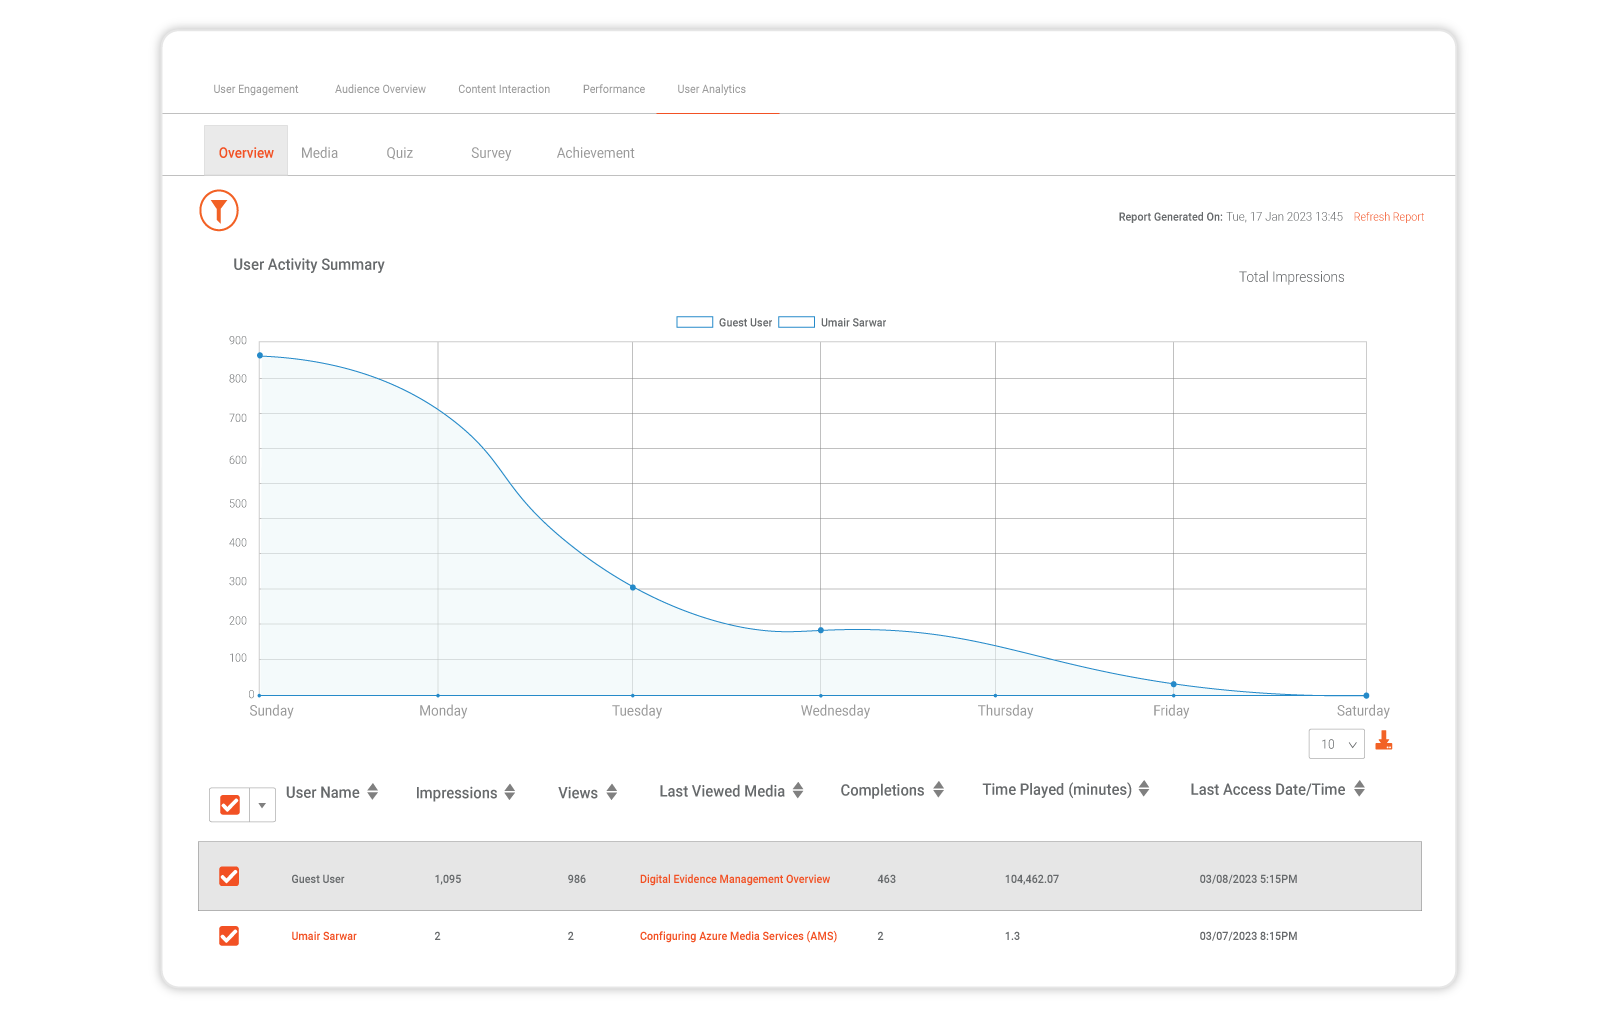
VIDIZMO offers user-specific data to showcase a dashboard of different interactivity stats for all the users in the VIDIZMO portal.
- Produce detailed user insights explaining what videos were watched by which user, how much, and what was their understanding of the video generated through quizzes assigned to them.
- Track detailed statistics to analyze per user engagement through data like user media progress, impressions, views, completions, and interactions.
- Study the user journey more efficiently and examine them to evaluate the usefulness of your media
Want Even More Detail? Integrate With Other Tracking Applications
Use Google Analytics? Woopra? Any other enterprise analytics application? Utilize VIDIZMO’s native and custom integrations to combine your video analytics with other types of tracking tools for enhanced monitoring of real-time web traffic and interactions.
Key Analytics Capabilities

Real-Time Live Stream Monitoring
Easily monitor in real-time the current and unique viewership trends of your live streams for swift analysis of content interaction and user engagement.

Quality of Experience Analytics
Monitor end-user quality of experience for a single video, multiple videos, or the entire video library to track metrics like load time and player buffering rate – visually viewable through graphs, tables and heat maps.

User Engagement Dashboard
Know precisely what viewers watch the most (completion, time played and individual user activity)

Audience Overview Dashboard
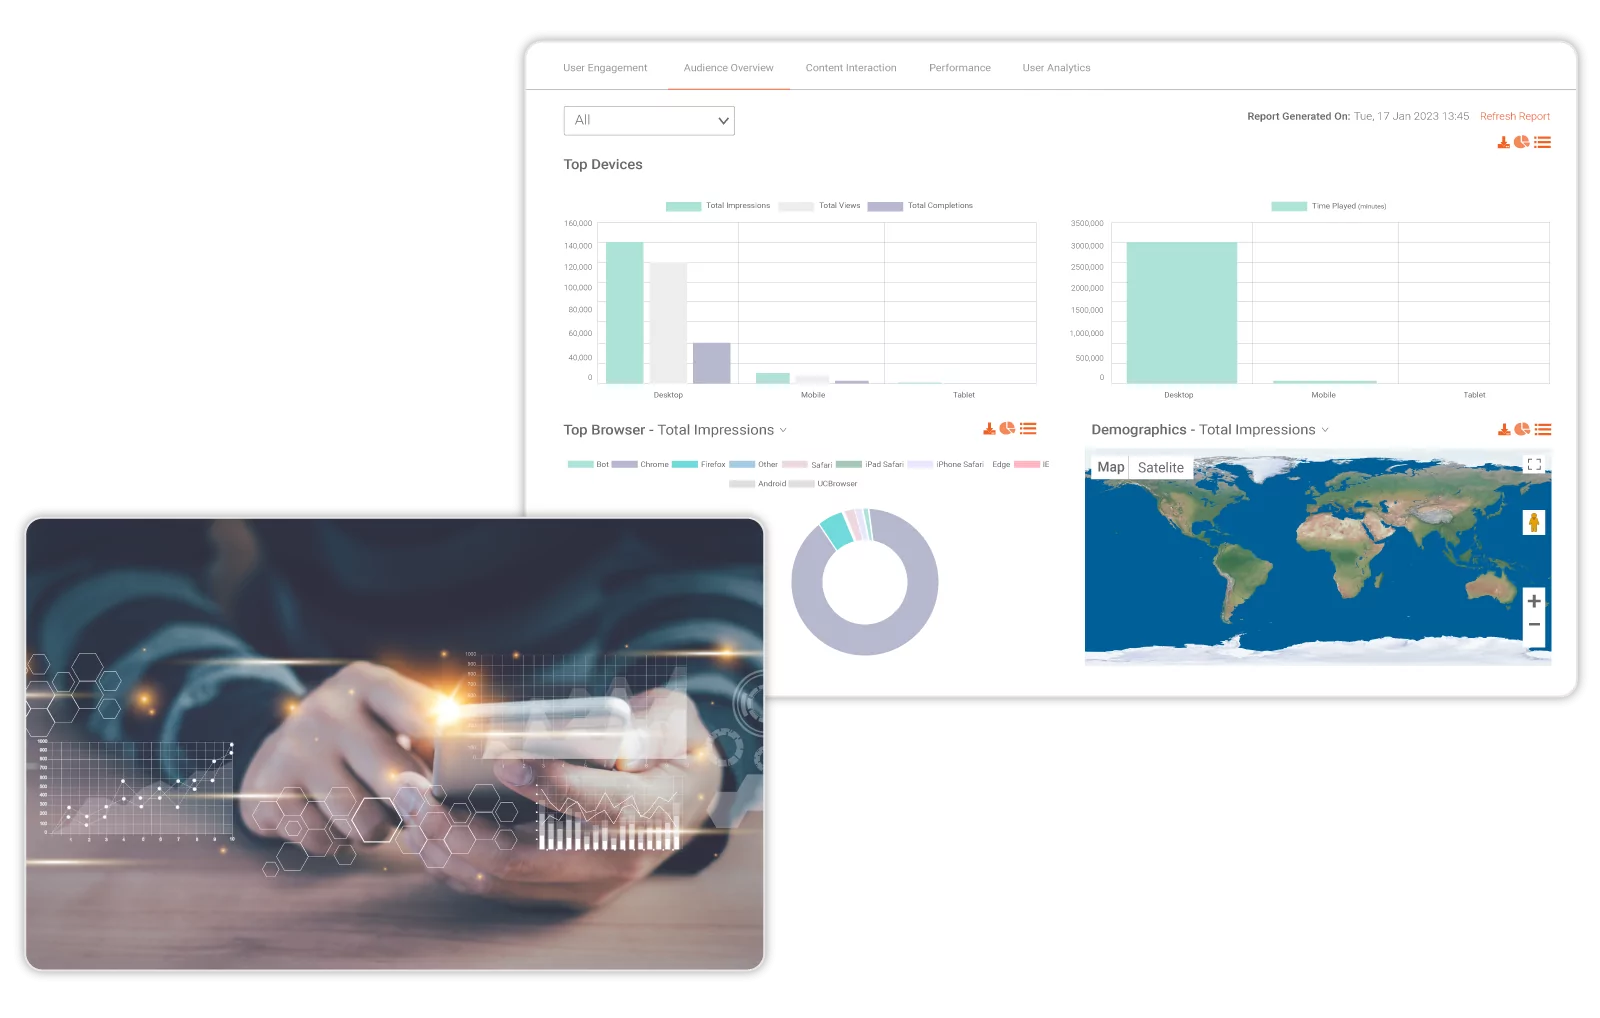
Know who your audience is; the regions they come from, and the devices and browsers used.

Content Interaction Dashboard
What type of content garners the most audience interaction? How many total likes do your videos get? Who shares, downloads and embeds what? Find out all this and more linked to interactions generated!

Performance Dashboard
Provide consistent video delivery by monitoring the portal-level quality of experience and media performance through metrics like load time, buffering, and errors.

Reporting of Interactive Videos
View individual quiz assessment and survey reports for videos with quizzes and surveys placed in them.

Activity Logs
View activity logs for every video showing exactly what activity was performed on them by which user and at what time.

Custom Reports

Billing Reports
View detailed billing reports and set alerts for each separate portal and account to know of expenses incurred for all your various departments.

Export Reports
Download any of the individual, bulk or consolidated dashboard video analytics as reports to efficiently present them to your stakeholders or for record-keeping.

Integrations
Out-of-the-box integrations available with tracking applications like Google Analytics, Woopra, and other enterprise analytics tools, alongside custom integrations as part of professional service.

Video Embedding Analytics
Video analytics also show where they are embedded and how many views each embedded video generates.
